Zacc's documentation
Reports
Learn how to use the great reports provided by Zacc
Common options
This section describes the options that are common to all reports.
Restricting data to a specific period
- Check the “Restrict to operations between” checkbox
- Specify a start date and an end date (the end date is included)
- Click on the “Draw” button”
![]()
Exporting the chart as an image
- Click on the “Save as PNG” button
- Choose the destination path and filename
Category pie chart
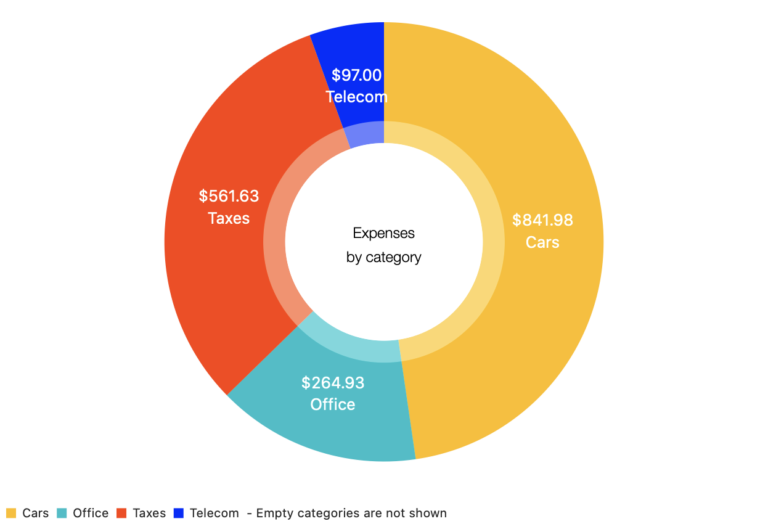
The Category Pie chart can show you either:
- The expenses for each category
- The incomes for each category
![]()
And you can restrict the data to a specific period of time as well.
Expenses and Incomes by Period - Bar Chart
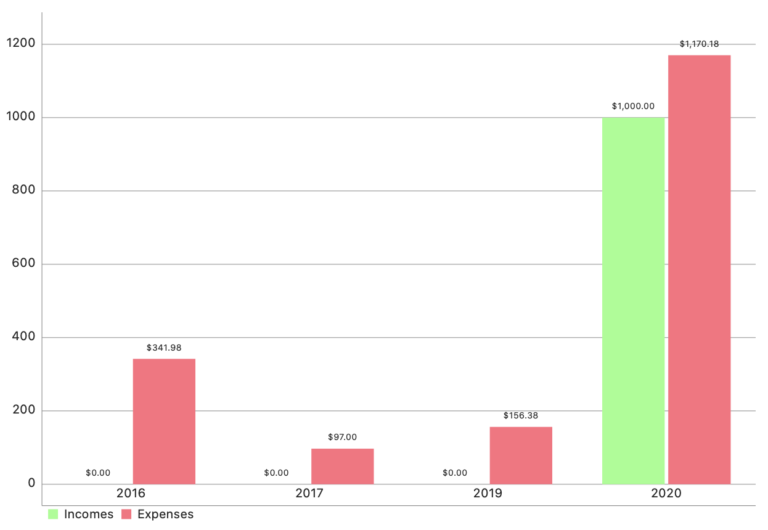
The bar chart allows you to see the expenses and incomes by period. The period is either:
- Month
- Year
![]()
And you can restrict the data to a specific period of time as well.
Cash-flow over time - Line Chart
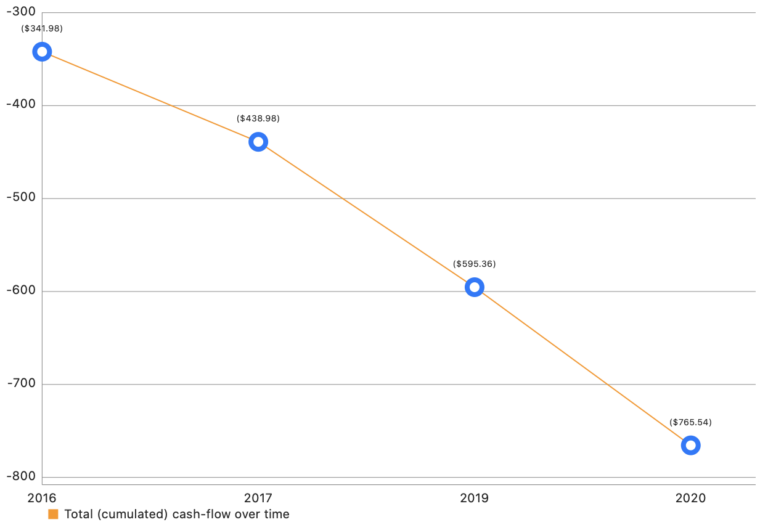
The line chart displays the available cash over-time. The values are the cumulative sum of each period total result (incomes minus expenses).
You can choose the granularity:
- Month period
- Year period
![]()
And you can restrict the data to a specific period of time as well.